C++ Containers, Threads and -O2: Performance Measured
C++ lecture 6 on clang 21: vector, list, deque, map and unordered_map timed, reserve and SSO, a TSan data race, atomics vs mutex, -O0 vs -O2.
Series: C++ lecture 6/6 (advanced). For readers who can write templates and use the STL (lecture 5) and now have to make C++ code fast or make it run on several cores. After this lecture you can pick a container from measurements instead of Big-O alone, avoid hidden allocations with reserve and the small-string optimisation, catch a data race with ThreadSanitizer, choose between a mutex, an atomic and no sharing at all, and explain why a debug build can be 30× slower.
Performance advice in C++ is full of rules that were true on some machine in some year: "use list for inserts", "atomics are lock-free so they are fast", "-O0 is fine for testing". This lecture checks each one on a current machine. Everything below was compiled and run with Apple clang 21.0.0 and libc++ on an Apple Silicon Mac (M1 Pro, 8 hardware threads), macOS 26, clang++ -std=c++23 -Wall -Wextra -pedantic -O2 unless stated, with fixed seeds and medians. GCC, MSVC, Linux and Valgrind were not run here; on another CPU the ratios will differ, but the reasons will not.
Five containers, four workloads
We timed the standard sequence and associative containers on ints. Keys are 0..N-1 shuffled with std::mt19937 seed 42, probes are random keys from a second draw of the same generator, each timing is the median of 5 runs.
template <class F> double med_ms(F f) {
    std::vector<double> t;
    for (int r = 0; r < 5; ++r) {
        auto a = clk::now(); f(); auto b = clk::now();
        t.push_back(std::chrono::duration<double, std::milli>(b - a).count());
    }
    std::sort(t.begin(), t.end());
    return t[2];
}
// e.g. med_ms([&] { sink = std::accumulate(l.begin(), l.end(), 0LL); });
| Workload | vector | deque | list |
|---|---|---|---|
push_back 1,000,000 |
0.69 ms | 0.98 ms | 25.04 ms |
| sum 1,000,000 | 0.05 ms | 0.49 ms | 1.15 ms |
sum after l.sort() (same nodes, scattered order) |
— | — | 61.31 ms |
| 20,000 inserts at the front | 11.08 ms | 0.04 ms | 0.48 ms |
| 20,000 inserts at a random position (walk + insert) | 5.74 ms | — | 439.65 ms |
| Workload (N = 1,000,000 keys) | map | unordered_map | sorted vector + lower_bound |
|---|---|---|---|
| build | 378.06 ms | 34.17 ms | 20.15 ms (copy + sort) |
| 1,000,000 random lookups | 378.19 ms | 10.66 ms | 45.37 ms |

What these numbers say:
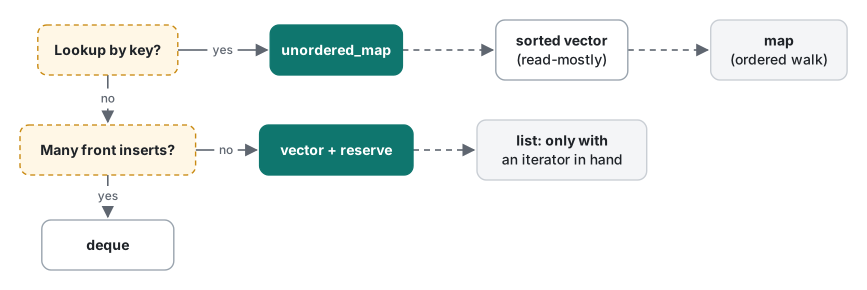
listlost almost everything. Everypush_backallocates a node (25 ms vs 0.7 ms). Summing was "only" 23× slower than vector while the nodes still sat in allocation order; afterl.sort()relinked them, the same sum took 61 ms (52.7 ms in another run), because each step now jumps to an unpredictable address and misses the cache. This is the linked list trade-off in numbers.- Middle inserts: vector wins by 77×, even though
list::insertis O(1). Finding the position is O(n) in both, and walking 10,000 list nodes is far slower thanmemmoveover 40 KB of contiguous ints. - Front inserts are the one case for
deque: 0.04 ms against vector's 11 ms, because vector shifts every element each time. unordered_mapwas 35× faster thanmapfor lookups.mapis a red-black tree: 20 levels of pointer chasing per lookup. A sorted vector with binary search sits between them and wins on build time and memory.
Java has the same story with ArrayList vs LinkedList; see our Java collections measurements.
reserve and hidden allocations
push_back into an empty vector grows by doubling in libc++. We counted calls to operator new while pushing 1,000,000 ints:
vector<int> 1M push_back, reserve=0: allocations=21 final capacity=1048576
vector<int> 1M push_back, reserve=1: allocations=1 final capacity=1000000
21 allocations and 20 copies of the growing buffer, versus one. For 10,000,000 push_backs the time went from 5.0 to 5.9 ms down to 3.1 to 3.3 ms (median of 7, two runs). Doubling is already cheap, so reserve is a 1.6× win here, not a 10× one; it matters most when elements are expensive to move or when you also want to avoid wasting the unused 48,576 slots.
Small-string optimisation: where the 23rd character costs
A std::string stores short strings inside the object itself and only allocates for longer ones. This is the small-string optimisation (SSO). How short is short? We counted allocations:
std::printf("sizeof(std::string)=%zu  capacity of empty string=%zu\n",
            sizeof(std::string), std::string().capacity());
for (int len : {0, 15, 22, 23, 24, 100}) {
    n_alloc = 0;
    std::string s(len, 'x');
    std::printf("len %3d: allocations=%ld capacity=%zu\n", len, n_alloc, s.capacity());
}
sizeof(std::string)=24  capacity of empty string=22
len   0: allocations=0 capacity=22
len  15: allocations=0 capacity=22
len  22: allocations=0 capacity=22
len  23: allocations=1 capacity=24
len  24: allocations=1 capacity=31
len 100: allocations=1 capacity=103
On libc++ a string is 24 bytes and holds up to 22 characters without touching the heap. Building 1,000,000 strings into a reserved vector took 5.9 ms at length 22 and 17.7 ms at length 23 (median of 5 after a warm-up run; one run measured 8.2 ms for length 22). That one character tripled the cost. It also explains lecture 4's copy test: 32-character strings each needed an allocation. libstdc++ (GCC) uses a 32-byte string with 15 inline characters (not run here).
Threads, std::async and a data race caught by TSan
std::thread runs a function on a new OS thread; you must join() it before it is destroyed. C++20's std::jthread joins automatically in its destructor (it worked on this libc++). std::async runs a task and gives you a std::future; get() waits for the result and rethrows any exception from the task.
auto f = std::async(std::launch::async, [&] { return sum_range(v, 0, h); });
long long right = sum_range(v, h, v.size());
long long total = f.get() + right;
async task on another thread: 1
total=32000004000000 expected=32000004000000 hw threads=8
deferred task on main thread: 1
Pass std::launch::async explicitly: with std::launch::deferred the task ran on the calling thread at get(), which is the classic "why is my async not parallel?" bug.
Now the bug every concurrency course starts with. Two threads increment one plain int:
#include <thread>
#include <cstdio>
int counter = 0;
void work(){ for(int i=0;i<100000;i++) counter++; }
int main(){
  std::thread a(work), b(work);
  a.join(); b.join();
  std::printf("counter=%d (expected 200000)\n", counter);
}
$ clang++ -std=c++23 -O0 race.cpp -o race0 && ./race0      (5 runs)
counter=102379 (expected 200000)
counter=102276 (expected 200000)
counter=118794 (expected 200000)
counter=102211 (expected 200000)
counter=101185 (expected 200000)
$ clang++ -std=c++23 -O2 race.cpp -o race2 && ./race2      (3 runs)
counter=200000 (expected 200000)
At -O0 half the increments vanished: counter++ is a load, an add and a store, and the threads overwrite each other. At -O2 the answer was right every time, because the compiler turned the loop into one counter += 100000, which made the window tiny. The bug is still there; a data race is undefined behaviour, and the optimiser was free to do that (C lecture 5 shows more UB that changes with -O). ThreadSanitizer finds it regardless:
$ clang++ -std=c++23 -g -O1 -fsanitize=thread race.cpp -o race_tsan && ./race_tsan
==================
WARNING: ThreadSanitizer: data race (pid=42472)
  Write of size 4 at 0x000104434000 by thread T2:
    #0 work() race.cpp:4 (race_tsan:arm64+0x10000072c)
  Previous write of size 4 at 0x000104434000 by thread T1:
    #0 work() race.cpp:4 (race_tsan:arm64+0x10000072c)
  Location is global 'counter' at 0x000104434000 (race_tsan+0x100008000)
  Thread T2 (tid=26070715, running) created by main thread at:
    #4 main race.cpp:6 (race_tsan:arm64+0x100000778)
SUMMARY: ThreadSanitizer: data race race.cpp:4 in work()
==================
counter=200000 (expected 200000)
ThreadSanitizer: reported 1 warnings
So TSan does work on Apple Silicon macOS with Apple clang. Note that even the TSan build printed the right total; only the report told the truth. On this Mac the TSan binary then exited with status 134, so a CI script will see the failure. TSan cannot be combined with ASan in one build (clang++: error: invalid argument '-fsanitize=address' not allowed with '-fsanitize=thread'); make two builds.
Atomics vs mutex vs not sharing, measured
Fixing the race: 4 threads, each adds 1 to a shared counter 10,000,000 times (40,000,000 total), median of 5 runs. The threads are std::jthreads.
// mutex
run_threads([&](int) { for (int i = 0; i < PER; ++i) { std::lock_guard<std::mutex> g(m); ++n; } });
// atomic
run_threads([&](int) { for (int i = 0; i < PER; ++i) n.fetch_add(1); });
run_threads([&](int) { for (int i = 0; i < PER; ++i) n.fetch_add(1, std::memory_order_relaxed); });
// count locally, publish once
run_threads([&](int) {
    long long local = 0;
    for (int i = 0; i < PER; ++i) { ++local; asm volatile("" : "+r"(local)); }  // barrier: keep the loop
    n += local; });
| Strategy | 4 threads × 10M | 1 thread × 40M |
|---|---|---|
std::mutex per increment |
1,221.45 ms | 352.89 ms |
std::atomic fetch_add (seq_cst) |
1,566.97 ms | 274.29 ms |
fetch_add(1, memory_order_relaxed) |
647.83 ms | 86.87 ms |
| local count, one atomic add per thread | 3.39 ms | 12.47 ms |
single thread, plain long long |
12.45 ms | 12.54 ms |
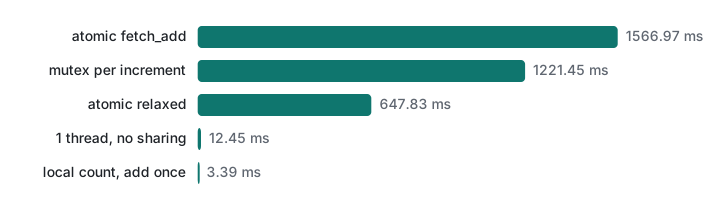
All five gave exactly 40,000,000. The results that matter:
- Under heavy contention, the mutex beat the default atomic. With one thread the atomic was faster (274 vs 353 ms), but with four threads hammering one cache line, every
fetch_addmoved that line between cores, while the mutex let one thread run several increments in a row. "Atomic is always faster" is false. - Sharing was the real cost. Four threads with a shared counter were 52 to 126 times slower than one thread with no sharing at all. Counting locally and publishing once was 3.6× faster than the single thread, the only version that actually used the cores.
memory_order_relaxedis correct for a pure counter that nobody uses to synchronise other data. If other threads read data "after seeing the count", you need the default ordering.
Rule: design so threads share as little as possible, then protect what remains with a mutex, and reach for atomics for single flags and counters.
-O0 vs -O2: why debug builds lie about speed
The same file, built twice, 10,000,000 ints (rng() % 1000, seed 42), median of 5:
| Code | -O0 | -O2 | Ratio |
|---|---|---|---|
raw for loop sum |
25.58 ms | 0.81 ms | 32× |
std::accumulate |
40.48 ms | 0.68 ms | 60× |
views::filter | views::transform sum |
328.39 ms | 33.63 ms | 10× |
raw loop with the same if |
113.80 ms | 1.19 ms | 96× |
std::sort (default <) |
122.37 ms | 91.13 ms | 1.3× |
std::sort with a lambda |
646.83 ms | 271.77 ms | 2.4× |
unordered_map::find × 10M |
281.38 ms | 9.43 ms | 30× |
Three lessons. First, STL code depends on inlining: at -O0 every operator[], iterator ++ and lambda call is a real function call, so std::accumulate was 60× slower than at -O2. Never judge C++ performance from a debug build. Second, std::sort with the default comparison barely changed, because libc++ ships it precompiled at full optimisation (lecture 5); a lambda comparator is compiled with your flags. Third, ranges are not automatically free: at -O2 the filter | transform pipeline took 33.6 ms while a plain loop with the same condition took 1.2 ms, which the compiler turned into branch-free vector code. Measure before using views on a hot path. For cache effects and profiling with lldb, see C lecture 6.
Common mistakes → what actually happened → fix
| Mistake | What we saw | Fix |
|---|---|---|
std::list "for fast inserts" |
77× slower than vector for random inserts | vector; list only when you already hold the iterator |
std::map for lookups by default |
35× slower than unordered_map |
unordered_map, or a sorted vector for read-mostly data |
plain int shared between threads |
lost increments at -O0, correct-looking at -O2 |
std::atomic or a mutex; test with -fsanitize=thread |
| atomic counter hammered by all threads | 1,567 ms, slower than a mutex | per-thread local counts, combine once |
std::async without a launch policy, or deferred |
ran on the caller's thread | std::launch::async |
| measuring speed in a debug build | 30–96× slower than release | measure at -O2, keep -g for symbols |
| strings just over 22 chars in hot loops | 3× slower than 22 chars | keep keys short, use std::string_view, or intern |
Honest limits / version notes
- Run only with Apple clang 21.0.0 and libc++ (
_LIBCPP_VERSION220106) on one M1 Pro, macOS 26. GCC/libstdc++, MSVC, Linux and Valgrind (helgrind) were not run. Ratios depend on the CPU's cache and core count; small differences (under ~10%) are within run-to-run noise. steady_clockon this Mac ticks in about 42 ns steps, so sub-microsecond timings are not reported.- Versions:
std::thread,std::async,std::mutex,std::atomicare C++11;std::jthreadis C++20 (__cpp_lib_jthread201911 here).std::hardware_destructive_interference_sizeis defined here (C++17).std::execution::parparallel algorithms are not available on this libc++;import std;failed withunknown type name 'import'(no standard library module is shipped with this toolchain). - The SSO limit (22), the growth factor (2) and the precompiled
std::sortare libc++ details. - TSan's exit status 134 is what we saw here; the documented default is a non-zero exit code when races are reported.
Exercises
1. Fix race.cpp so it prints 200000 at every optimisation level and TSan reports nothing. Use the smallest change.
2. Without running it, predict how many heap allocations each loop makes on libc++, then check with a counting operator new:
for (int len : {10, 30}) {
    std::vector<std::string> v;
    v.reserve(1000);
    for (int i = 0; i < 1000; ++i) v.push_back(std::string(len, 'x'));
}
Answers
1. Make the counter atomic:
#include <atomic>
std::atomic<int> counter{0};
void work(){ for(int i=0;i<100000;i++) counter++; }
// print with counter.load()
Under -fsanitize=thread it printed counter=200000 (expected 200000), no warning, exit 0. counter++ on a std::atomic<int> is an atomic fetch_add. For speed, the local-count version from the measurement section is better still.
2. Length 10: 1 allocation (the reserved buffer; 10 characters fit in the SSO buffer). Length 30: 1001 (the buffer plus one per string). The pushed temporaries are moved into the vector, and moving a heap string just hands over its pointer. Without reserve, length 30 made 1011: 11 more for the buffer growing 1, 2, 4, …, 1024.
Series wrap-up
That is the end of the C++ series. If you started at lecture 1, you can now build and debug with sanitizers, own resources with RAII and smart pointers, read template errors, and back a performance decision with a measurement. To recommend the series to someone new, send them to lecture 1.
FAQ
Is std::list faster than std::vector for inserting in the middle?
Not in our test. Inserting 20,000 ints at random positions, including walking to the position, took 5.74 ms with std::vector and 439.65 ms with std::list (median of 5, -O2, Apple Silicon M1 Pro). The list's insert itself is O(1), but finding the position means following 10,000 pointers on average, while the vector shifts contiguous memory with memmove. Use list only when you already hold the iterator.
Does ThreadSanitizer work on macOS with Apple clang?
Yes. clang++ -fsanitize=thread -g worked on Apple Silicon macOS 26 with Apple clang 21. Two threads incrementing a plain int got WARNING: ThreadSanitizer: data race with both stack traces and the line number. Without TSan the -O0 build printed totals like 102379 instead of 200000, and the -O2 build printed the right total, which hid the bug.
Is std::atomic always faster than std::mutex?
No. With 4 threads each doing 10,000,000 increments of one shared counter, a mutex took 1221 ms, atomic fetch_add 1567 ms, and fetch_add with memory_order_relaxed 648 ms. With a single thread the atomic was faster (274 vs 353 ms for 40,000,000). The real fix was to not share: each thread counting locally and adding once took 3.4 ms.