MySQL 1226 max_connections_per_hour on Shared Hosting
A cron hit MySQL 1226 (500/hour) while localhost PHP APIs ran ~1,500/hour fine. Limits are per user@host, so connect same-server jobs via localhost.
This is for anyone running apps, cron jobs and PHP pages against one MySQL user on shared hosting and seeing (1226, "User '<db_user>' has exceeded the 'max_connections_per_hour' resource"). The short version: MySQL counts this limit per account, and an account is user@host, so the same user name arriving through localhost and through the server's remote hostname can draw on different budgets. Our app APIs on localhost ran at about 1,500 connections an hour without a single failure, while a cron that connected through the remote hostname hit the 500/hour wall. The fix that matters: when a job runs on the same server as the database, connect via localhost. A narrow retry and a connection log support it.
Update (2026-11-10, evening): The first version of this post said that everything using the MySQL user shared one hourly budget of 500, and suspected an app usage peak. That evening our connection log showed the app APIs alone at about 1,500 connections an hour with requests still succeeding, which a single shared budget of 500 cannot explain. The diagnosis now points at the remote connection path, and the sections below have been revised; the old claim is corrected where it appeared.
Some parts of this story are still unknown, and we say so where they are.
The failure
The setting is Hostinger web hosting (LiteSpeed), with server time in UTC. A separate website has a refresh job written in Python 3.11 with PyMySQL. It runs from cron twice a day, at 12:00 and 21:00 UTC, on the same server as the database, and reads lottery results from MySQL to rebuild pages.
On 2026-11-09, the 12:00 UTC run (21:00 in Japan, a Monday evening right after a lottery draw) failed at its first step, the database connection:
pymysql.err.OperationalError: (1226, "User '<db_user>' has exceeded the
'max_connections_per_hour' resource (current value: 500)")
Some context from the cron's own log:
- It held about one month of runs, two per day. This was the only failure.
- The next run, at 21:00 UTC, succeeded without any change.
So this was not a broken job. Something used up a budget of 500 connections in the hour before 12:00 UTC, and the cron was the one that hit the wall and logged it. The open question was which budget, and who else draws on it.
One user name, two connection paths
The same MySQL user name is used by much more than this one cron. What we had not looked at closely in the first version is how each consumer reaches the database:
| Consumer | How often | Connection path |
|---|---|---|
| PHP JSON APIs of 8 mobile apps | one connection per request | localhost |
| Old WebView-era PHP pages | opened by installed old app versions | localhost |
| An ad-configuration endpoint | called by 16 apps on every launch | same server, presumably localhost |
| Push-notification cron | every 5 minutes | not checked yet |
| The other website's refresh cron (the one that failed) | 12:00 and 21:00 UTC | the database server's remote hostname (until the fix below) |
| An external crawler PC | writes results over remote MySQL | remote hostname |
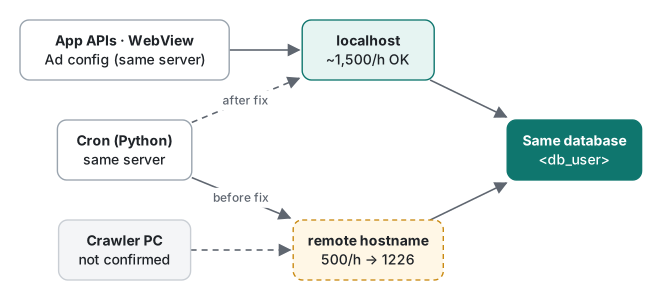
The cron is a Python script on the same machine, yet its config pointed at the database server's remote hostname, the address an outside machine must use. That is easy to do: the remote hostname works from your laptop and from the server alike, so a script developed locally and then copied to the server keeps it. The PHP code, written for the server from day one, simply says localhost.
The numbers that changed the diagnosis
The connection logger described in Fix 2 below ran from 16:17 JST on 2026-11-10. It counts only the app JSON APIs, which connect via localhost:
| Hour (JST) | Logged connections | Compared with 500 |
|---|---|---|
| 16:00 (from 16:17) | 559 | above |
| 17:00 | 592 | above |
| 18:00 | 491 | just under |
| 19:00 | about 1,557 | about 3× |
| 20:00 | about 1,503 | about 3× |
If every consumer shared one budget of 500, those evening hours would have been a wall of 1226 errors. They were not. At 20:52 JST we spot-checked 4 API endpoints, and all returned 200 with full JSON bodies. The app traffic on localhost was running at three times "the limit" and working.
That leaves the one connection we know failed: the cron's, through the remote hostname, with current value: 500 in the message.
What we know and what we don't
What MySQL does. MySQL identifies an account as 'user'@'host', and resource limits such as MAX_CONNECTIONS_PER_HOUR belong to the account. A login from localhost and a login over TCP from elsewhere can match different account rows even when the user name is identical.
What we observed. Localhost connections at about 1,500 an hour succeeded. The remote-path connection hit 1226 with a limit of 500. We cannot see the host's account table, so we do not claim how the host has configured each account; we report only what each path did.
The most likely explanation, and it is not confirmed: the remote-path account ('<db_user>'@'%') carries the 500/hour limit, and it was used up on Monday evening by the external crawler, which writes results over remote MySQL around the draw, plus the cron itself. We have no log of the crawler's connections, so we cannot show that it made hundreds of connections in that hour. It is the only known heavy remote client, and the timing fits a post-draw run, but that is inference.
What this corrects. The first version suspected an app usage peak. The numbers above argue against it: the apps connect via localhost, and localhost ran far past 500 without errors. The PHP error log had no 1226 entries on 2026-11-09 either, which now looks consistent rather than suspicious. One caveat stays: the legacy connection function is
if(!($Conn = mysqli_connect(HOST, USER, PASS))) { die; }
and on PHP 8.1+ its behaviour on failure depends on the mysqli report mode, so a silent failure would not appear in that log. Tonight's spot check makes that unlikely for the localhost path, but we did not check the apps during the 2026-11-09 hour itself.
What we ruled out, as before: our own work that day. The regression tests ran in the afternoon, not between 20:00 and 21:00 JST, and the API move did not change the number of connections per request.
Splitting users is off the table, localhost is not
Because limits are per account, the textbook fix is to give each consumer its own MySQL user. On Hostinger web and cloud hosting this is not possible on our plan: you get one user per database, and phpMyAdmin has no CREATE USER or GRANT privilege, so you cannot work around it from SQL. That part of the first version still holds.
What we missed is a cheaper fix that needs no new user at all: if the job runs on the same server, connect via localhost instead of the remote hostname. Then it no longer shares the remote account's budget with external clients such as the crawler. The crawler itself has no such option, since it runs elsewhere, but the cron does.
We still made two other changes first, and they stay: a retry so the failing job survives a full budget, and a log to see where connections go.
Fix 1: retry the cron's connect, and only that
Deployed on 2026-11-10. The rules:
- Retry only the database connect, only in the cron entry point.
- Retry only on MySQL error 1226 (per-hour limit) and 1040 (too many connections).
- Wait 900 seconds between tries, up to 3 times, so at most 45 minutes.
- Any other error, such as authentication (1045) or an unreachable host, fails immediately.
- Manual tools that call the same helper use
retry=Falseand fail fast. When a person is running a command, an error now is better than a silent 45-minute wait.
The real code, lightly trimmed:
RETRY_MYSQL_CODES = (1226, 1040)

def lotto_conn(retry=False, waits=(900, 900, 900)):
    import time
    import pymysql
    for attempt in range(len(waits) + 1 if retry else 1):
        try:
            return _lotto_connect(pymysql)
        except pymysql.err.OperationalError as e:
            code = e.args[0] if e.args else None
            if not retry or code not in RETRY_MYSQL_CODES or attempt >= len(waits):
                raise
            print("  DB connection limit (%s) - retry in %ds (%d/%d)"
                  % (code, waits[attempt], attempt + 1, len(waits)), flush=True)
            time.sleep(waits[attempt])
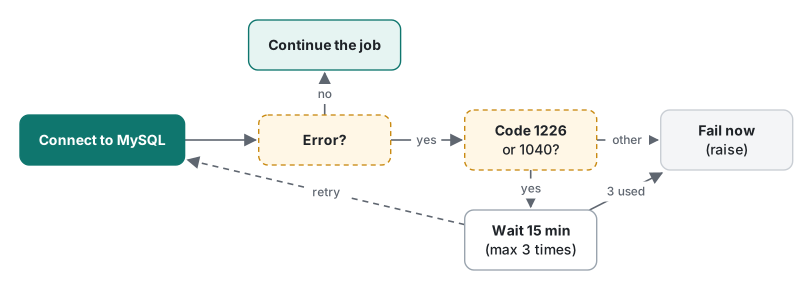
Why 15 minutes and not a few seconds: the budget is hourly. Retrying after five seconds would almost certainly hit the same full budget again. Three waits of 15 minutes spread the attempts over most of the hour.
Waiting introduces a new risk: a run that sleeps could still be running when the next one starts. The shell wrapper around the job handles that. It takes a mkdir lock (atomic on the same filesystem), and it writes a last-run timestamp before starting, with a minimum gap of 6 hours. A delayed 12:00 run makes its last connection attempt about 45 minutes late, and nothing can start a second copy while it is still waiting.
We tested it with fake errors injected in place of the real connect, in 4 cases:
| Case | Expected | Result |
|---|---|---|
| 1226 twice, then success | connects on the 3rd try | connects |
| 1226 four times | gives up and raises 1226 | raises 1226 |
| 1045 (auth error) | raises at once, no wait | raises at once |
retry=False with 1226 |
raises at once | raises at once |
What this does not prove: that it works against a real 1226 in production. That has not happened since the deploy. Until it does, treat the retry as tested logic, not proven behaviour.
Fix 2: count connections without changing responses
Started on 2026-11-10. Since we cannot see access logs, we made the shared PHP connection function write one line per connection to a daily file outside the web root:
function conn_log() {
    $dir = dirname(__FILE__) . '/logs';           // outside the web root
    if (!is_dir($dir)) { @mkdir($dir, 0700); }
    $uri = isset($_SERVER['REQUEST_URI']) ? strtok($_SERVER['REQUEST_URI'], '?') : '-';
    $act = isset($_GET['action']) ? preg_replace('/[^A-Za-z0-9_]/', '', (string)$_GET['action']) : '';
    $line = gmdate('Y-m-d H:i:s') . "\t" . substr((string)$uri, 0, 120) . "\t" . substr($act, 0, 40) . "\n";
    @file_put_contents($dir . '/conn-' . gmdate('Ymd') . '.log', $line, FILE_APPEND | LOCK_EX);
}
Design choices:
- UTC time, path without the query string, and only the
actionparameter. Search keywords and other parameters are deliberately not logged. They can contain whatever users typed, which we do not want to store, and they would make the file much larger for no benefit. To count connections per endpoint per hour, the path and the action are enough. - Errors are suppressed with
@. If the disk is full or the folder cannot be created, the API still answers exactly as before. The response body is unchanged. - Removing it is one line: the call inside the connection function.
The limitation matters: the ad-config endpoint and the WebView pages use their own connection code, not the shared function, so they are not counted. The log also sees nothing on the remote path: the cron and any external client never pass through this PHP function. So the numbers are a lower bound for the localhost path only, not a total for the user.
Fix 3: try localhost first, fall back to the remote hostname
Deployed on 2026-11-10 at 21:29 JST. The cron now tries the local paths first, a Unix socket if one exists and then 127.0.0.1, each with a 5-second timeout. If the local attempts fail, it falls back to the remote hostname with a 20-second timeout. It logs which path it used, local or remote, and never the address. Simplified from the real code:
def connect():
    tries = [("local (socket)", {"unix_socket": s}) for s in SOCKETS if os.path.exists(s)]
    tries.append(("local (127.0.0.1)", {"host": "127.0.0.1", "port": 3306}))
    tries.append(("remote", {"host": REMOTE_HOST, "port": 3306}))
    for i, (label, where) in enumerate(tries):
        last = i == len(tries) - 1
        try:
            conn = pymysql.connect(**where, user=USER, password=PASSWORD, database=DB,
                                   connect_timeout=20 if last else 5)
            print("DB path:", label)          # the label only, never the address
            return conn
        except pymysql.err.OperationalError:
            if last:
                raise
SOCKETS is a short list of common socket locations; only those that exist are tried. The 1226/1040 retry from Fix 1 wraps this whole function, so a full budget on whichever path is finally used still gets the long waits.
Why a fallback instead of hard-coding localhost: the same helper runs on developer machines, where there is no local MySQL. We tested exactly that case. On a laptop the local attempt fails immediately with error 2003 (cannot connect), and the remote attempt succeeds. The short local timeout keeps that detour cheap.
Why log the label: it is the only way to know, from the cron log alone, whether the server actually took the local path. Result (added 2026-11-11): the first server run, at 06:00 JST on 2026-11-11, logged the local (socket) path label and finished normally. So on this host a Unix socket for the local MySQL exists, and the same user name logs in through it without any change to the password or privileges. The cron no longer shares the remote account's hourly budget with the crawler.
Our own tests used 300 connections, on the other path
Right after deploying the logger, we ran one regression pass to confirm nothing had changed: an API snapshot comparison against about 60 endpoints, saving a new snapshot, and a quick URL check.
It used about 300 connections in roughly 2 minutes, out of 559 for the whole 16:00 JST hour. In the first version we concluded that a single test run could eat more than half of the 500 hourly budget, and that testing in the evening could have caused the incident by itself.
That conclusion was wrong. The tests call the APIs, and the APIs connect via localhost. The 300 connections were real, but they did not count toward the budget that failed; the evening hours showed localhost handling three times that load. We keep the rule no full regression runs during the evening peak (20:00–22:00 JST), and never two in the same hour, but as general caution about load on a shared server, not because it caused 1226.
The measurement is still useful as a sizing number: one full pass is roughly 300 connections in 2 minutes, and that is worth knowing before anyone schedules it in a loop.
A smaller practice point from the same run: after a day passes, the snapshot comparison flagged about 30 responses as different. They were today's horoscope, new draw results and similar content that changes by date. We did not judge them by hash. We compared status code, content type and JSON shape (keys and value types), and all three were identical for every flagged response. A hash tells you that something changed. The shape tells you whether the contract changed.
Which fix when
| Fix | When it fits | Cost / caution |
|---|---|---|
| Connect via localhost when the job runs on the same server | Cron or worker on the database host that uses the remote hostname today | Cheapest; keep the remote hostname as a fallback and log which path was used. Our server result is still pending |
| Retry with long waits in batch jobs | Cron or worker that can afford to run late | Only for 1226/1040; needs a lock so delayed runs cannot overlap |
| Split DB users | VPS or a control panel that allows several users per database | The clean fix, since limits are per account; not available on our plan |
| Cache read-only GET responses | Heavy endpoints whose data changes a few times a day | Reduces load; on our setup it does not touch the remote budget that hit 1226 |
| Persistent connections | Rarely on shared PHP hosting | Often not available or not advisable there; treat with caution, not as a default |
| Ask the host about the limit | When a measured peak on one path is close to its limit | Depends on the host and plan; ask which account and path the limit applies to |
Next step
The 06:00 JST run on 2026-11-11 took the local (socket) path, as described above. What is left is time: whether 1226 stays away on the following runs, especially around the next Monday-evening draw, which is when the first failure happened. One clean run is a good sign, not proof.
Caching the heaviest read-only GET endpoints is still on the list, but it is now about server load, not about the 1226 limit, since those endpoints run on the localhost path. We will update this post with the cron's path, the next week of hourly numbers, and any sign of the crawler's share.
FAQ
What does MySQL error 1226 'exceeded the max_connections_per_hour' resource mean?
The MySQL account has used up its hourly connection budget. MySQL counts resource limits per account, and an account is a user name plus a host, so '<db_user>'@'localhost' and '<db_user>'@'%' are different accounts. In our case the error showed a limit of 500 on the path through the remote hostname, while connections through localhost ran at about 1,500 an hour without errors.
Why did my PHP APIs keep working while my cron got 1226?
Most likely because they connect through different paths. Our PHP APIs connect with host localhost; the failing cron connected through the database server's remote hostname, the same path an external crawler uses. Only the remote path hit its limit. This is the most likely explanation, not a confirmed one: we have no log of the crawler's connections.
Should I retry when a connection fails with 1226?
In a batch job, yes, but only for 1226 and 1040, and with long waits, because the budget is hourly. We wait 900 seconds up to three times. Authentication or host errors should fail immediately, and request handlers serving users should not sleep for minutes.
Can I create a second MySQL user on Hostinger web hosting to split the limit?
Not on the plan we use: one user per database, and no CREATE USER or GRANT in phpMyAdmin. A cheaper option, if the job runs on the same server as the database: connect via localhost instead of the remote hostname, so it does not share the remote account's budget with external clients.