Python Profiling: What Actually Made Code Faster
timeit, cProfile and tracemalloc on a slow word counter: 4.39 s down to 31 ms step by step, and the folk optimizations that did nothing when measured.
Series: Python lecture 6/6 (advanced). For developers whose Python works but is too slow, and who want a method rather than a list of tricks. After this lecture you will be able to measure, find the real hotspot, fix it and prove the fix, and you will know which popular "speed tips" are worth ignoring.
This lecture solves the problem of the developer who has already rewritten three loops "for speed" and gained nothing. We take one deliberately slow program, profile it and fix it one step at a time, with a measured time after every step. The result: one change gave a 78× speedup of the whole program, and most of the famous micro-tricks moved the total by less than the noise.
All timings were made on Python 3.9.6 on an Apple Silicon Mac (M1 Pro). We also have a Python 3.11 here, but it runs under Rosetta 2 translation, so we did not time anything with it. More on that at the end.
The slow program
A word-frequency counter: 200,000 words drawn from a vocabulary of 5,000 random words (fixed seed 42), lower-cased, deduplicated in first-seen order, counted, and the top 5 printed. It is written the way many first versions are written.
# wordfreq_slow.py
import random

def make_words(n=200_000, vocab=5_000, seed=42):
    rnd = random.Random(seed)
    letters = "abcdefghijklmnopqrstuvwxyz"
    pool = ["".join(rnd.choice(letters) for _ in range(rnd.randint(3, 9))) for _ in range(vocab)]
    return [rnd.choice(pool) for _ in range(n)]

def normalize(words):
    text = ""
    for w in words:
        text += w.lower() + " "          # string concat in a loop
    return text.split()

def unique_in_order(words):
    seen = []
    for w in words:
        if w not in seen:                 # list membership: O(n)
            seen.append(w)
    return seen

def count(words):
    counts = {}
    for w in words:
        if w in counts:
            counts[w] = counts[w] + 1
        else:
            counts[w] = 1
    return counts

def top(counts, k=5):
    return sorted(counts.items(), key=lambda kv: (-kv[1], kv[0]))[:k]

def main():
    words = normalize(make_words())
    uniq = unique_in_order(words)
    counts = count(words)
    return len(words), len(uniq), top(counts)

if __name__ == "__main__":
    import time
    t = time.perf_counter()
    print(main())
    print(f"{time.perf_counter() - t:.2f} s")
(200000, 4985, [('mor', 96), ('jwc', 90), ('fyg', 89), ('tksm', 86), ('bef', 82)])
4.08 s
Before reading on, guess which part is slow. Most people pick the string concatenation, because every tutorial warns about it.
Step 1: measure correctly with timeit
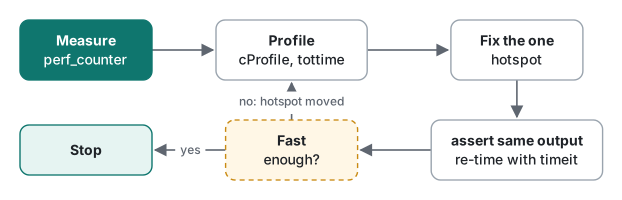
time.perf_counter() around a whole run is fine for seconds. For anything smaller, use timeit: it runs the statement many times, repeats that 5 times, and you take the best (the minimum is the run least disturbed by other processes).
$ python3 -m timeit -s "from wordfreq_slow import make_words" "make_words()"
5 loops, best of 5: 81.7 msec per loop
Common mistake: timing something that changes its own input
$ S="import random; random.seed(1); data = [random.random() for _ in range(100_000)]"
$ python3 -m timeit -s "$S" "data.sort()"
1000 loops, best of 5: 215 usec per loop
$ python3 -m timeit -s "$S" "sorted(data)"
20 loops, best of 5: 12.4 msec per loop
$ python3 -m timeit -s "$S" "d = data[:]; d.sort()"
20 loops, best of 5: 12.5 msec per loop
What actually happens: setup runs once. The first data.sort() sorts the list in place, and the other 4,999 calls sort an already-sorted list, which Timsort finishes in one linear pass. The result, 215 µs, is 58× too optimistic. Fix: copy inside the statement (d = data[:]; d.sort()) and, if you want, time the copy alone (data[:] took 150 µs) to subtract it. Any benchmark that mutates its input (sort, pop, dict updates, caches) has this problem.
Step 2: find the hotspot with cProfile and pstats
$ python3 -m cProfile -s tottime wordfreq_slow.py
(200000, 4985, [('mor', 96), ('jwc', 90), ('fyg', 89), ('tksm', 86), ('bef', 82)])
4.33 s
         1562316 function calls (1562289 primitive calls) in 4.335 seconds

   Ordered by: internal time

   ncalls  tottime  percall  cumtime  percall filename:lineno(function)
        1    4.111    4.111    4.111    4.111 wordfreq_slow.py:16(unique_in_order)
   235049    0.055    0.000    0.074    0.000 random.py:237(_randbelow_with_getrandbits)
   230049    0.046    0.000    0.125    0.000 random.py:343(choice)
        1    0.024    0.024    0.037    0.037 wordfreq_slow.py:10(normalize)
        1    0.022    0.022    0.132    0.132 wordfreq_slow.py:8(<listcomp>)
        1    0.018    0.018    0.018    0.018 wordfreq_slow.py:23(count)
tottime is time spent inside the function itself; cumtime includes everything it called. One function, unique_in_order, is 4.11 of 4.34 seconds (95%). normalize, the string concatenation everyone suspected, is 0.037 s in total. If we had "fixed" it first, we could have saved at most about 0.01-0.04 s of a 4-second run.
To profile just one function from code, and sort by cumulative time:
import cProfile, pstats, wordfreq_slow as m
pr = cProfile.Profile(); pr.enable(); m.main(); pr.disable()
pstats.Stats(pr).strip_dirs().sort_stats("cumulative").print_stats(8)
         1560940 function calls in 4.153 seconds

   Ordered by: cumulative time
   List reduced from 28 to 8 due to restriction <8>

   ncalls  tottime  percall  cumtime  percall filename:lineno(function)
        1    0.000    0.000    4.153    4.153 wordfreq_slow.py:35(main)
        1    3.934    3.934    3.934    3.934 wordfreq_slow.py:16(unique_in_order)
        1    0.000    0.000    0.159    0.159 wordfreq_slow.py:4(make_words)
        1    0.022    0.022    0.131    0.131 wordfreq_slow.py:8(<listcomp>)
   230049    0.045    0.000    0.125    0.000 random.py:343(choice)
Note that cProfile has overhead on Python-level calls: make_words shows 0.159 s here but takes 81.7 ms under timeit. Use the profiler to find where, and timeit to measure how much.
Step 3: fix the hotspot, then the rest, measuring each step
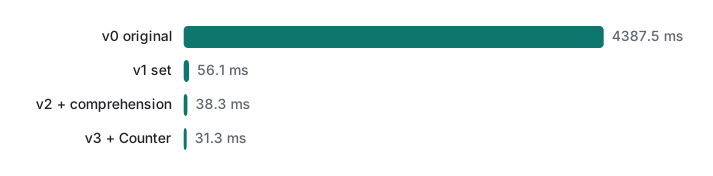
Each version below was checked to give exactly the same unique list and counts as the original (an assert in the script), then timed as a median of 5 runs (3 for v0). Word generation is excluded, so these are the processing times only.
| Version | Change | Time | vs v0 |
|---|---|---|---|
| v0 | Original | 4,387.5 ms | 1× |
| v1 | Dedupe with a set instead of a list |
56.1 ms | 78× |
| v2 | Lower-case with a list comprehension, no giant string | 38.3 ms | 115× |
| v3 | dict.fromkeys for dedupe, Counter for counting |
31.3 ms | 140× |
The final version is short:
# wordfreq_fast.py
from collections import Counter
from wordfreq_slow import make_words

def main():
    words = [w.lower() for w in make_words()]
    uniq = list(dict.fromkeys(words))        # keeps first-seen order (3.7+)
    counts = Counter(words)
    top = sorted(counts.items(), key=lambda kv: (-kv[1], kv[0]))[:5]
    return len(words), len(uniq), top
It prints the same tuple in 0.12 s including word generation; now make_words (82 ms) is the biggest cost, which is where a profiler would point next.
Why step 1 is 78×: w not in seen on a list compares against every element, so 200,000 words × up to 4,985 unique words is hundreds of millions of comparisons. A set hashes the word once. The micro-benchmarks for each step (timeit, min of 5 repeats):
--- dedupe 200k words (min of 5 repeats, 1 loops each)
  list membership                     4252.94 ms   x  1.00
  set membership                         3.87 ms   x1099.67
  dict.fromkeys                          4.03 ms   x1056.10
--- build text (min of 5 repeats, 20 loops each)
  str += in loop                        29.19 ms   x  1.00
  join(generator)                       22.31 ms   x  1.31
  join([list comp])                     19.33 ms   x  1.51
--- count words (min of 5 repeats, 20 loops each)
  if w in d                             13.18 ms   x  1.00
  d.get(w, 0) + 1                       13.77 ms   x  0.96
  try/except KeyError                   12.01 ms   x  1.10
  defaultdict(int)                      10.53 ms   x  1.25
  Counter(words)                         6.27 ms   x  2.10
join([list comprehension]) beat join(generator): str.join builds a list from a generator anyway, so the generator only adds overhead. Counter(words) won because its counting loop runs in C; Counter with a manual c[w] += 1 loop would not.
Common mistake: += on an attribute is quadratic
The string concatenation in normalize was cheap, which surprises people. CPython has an optimization: when the left side of text += ... is a plain variable and nothing else references the string, it resizes the string in place. That optimization only applies when the target is a variable name. Assign to an attribute and it is gone:
# concat_attr.py
import time
from wordfreq_slow import make_words

class Buf:
    def __init__(self): self.text = ""

def local_concat(words):
    text = ""
    for w in words:
        text += w + " "
    return text

def attr_concat(words):
    b = Buf()
    for w in words:
        b.text += w + " "        # attribute target: no in-place resize
    return b.text

for n in (50_000, 100_000, 200_000):
    words = make_words(n)
    for f in (local_concat, attr_concat):
        t = time.perf_counter(); f(words); dt = time.perf_counter() - t
        print(f"{f.__name__:<13} n={n:>7,}: {dt*1000:8.1f} ms")
local_concat  n= 50,000:      4.5 ms
attr_concat   n= 50,000:    203.8 ms
local_concat  n=100,000:      8.9 ms
attr_concat   n=100,000:    717.7 ms
local_concat  n=200,000:     17.7 ms
attr_concat   n=200,000:   2948.9 ms
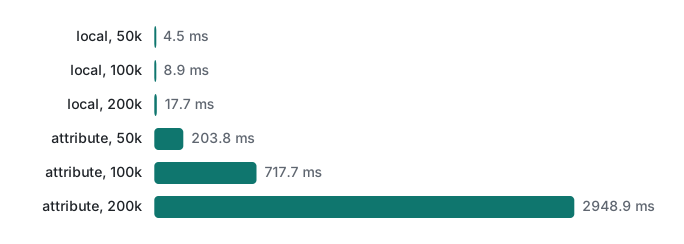
What actually happens: the local version grows linearly (4.5 → 8.9 → 17.7 ms). The attribute version roughly quadruples each time the input doubles (204 → 718 → 2,949 ms), because every += copies the whole string so far. Fix: collect parts in a list and "".join(parts) once, or build the string in a local variable and assign it to the attribute at the end. This is also why "use join" is still good advice: the fast path is a CPython implementation detail, and you lose it as soon as the code is refactored into a class.
Local lookups, comprehensions and map
--- 1M items: len(str(i)) (min of 5 repeats, 3 loops each)
  for + out.append (globals)           162.38 ms   x  1.00
  for + local aliases                  125.72 ms   x  1.29
  list comprehension                   139.07 ms   x  1.17
  map(len, map(str, ...))               93.13 ms   x  1.74
  map(lambda ...)                      132.86 ms   x  1.22
The "local alias" trick (append = out.append, len=len as a default argument) is real: 22% less time on 3.9, because looking up a local is cheaper than a global or builtin name, and out.append is no longer re-fetched each iteration. A list comprehension gets part of that for free and is easier to read. map with a builtin function was the fastest because no Python-level frame runs per item; map with a lambda loses that advantage. We would use the comprehension in real code: the alias trick buys 13 ms per million items and costs readability.
Folk optimizations that did not help (here)
Measured on 3.9, the advice that is not worth following in this kind of code:
| Folk tip | What we measured | Verdict |
|---|---|---|
"Replace str += with join" in a local loop |
29 → 19 ms; 0.04 s of a 4.4 s program | Fine to do, but it was never the bottleneck |
"d.get(k, 0) + 1 is faster than if k in d" |
13.77 vs 13.18 ms | Slightly slower; pick what reads best |
"try/except KeyError is faster than checking" |
12.01 vs 13.18 ms (9%) | Small, and it depends on how often the key is missing |
"map(lambda …) beats a loop" |
132.9 ms vs 139.1 ms comprehension | Within noise of the comprehension |
"join(generator) saves memory, so it is faster" |
22.3 ms vs 19.3 ms with a list | Slower; join makes a list anyway |
Two tips that did help, so you do not conclude that all folk advice is wrong: i * i instead of i ** 2 (34.97 vs 214.50 ms for a million squares, 6.1×) and for i in range(N) instead of a while counter (28.68 vs 57.43 ms). Both are about avoiding work in the interpreter loop, and sum(range(N)) (10.25 ms) beats both by doing the loop in C. The pattern: tricks that move work into C help; tricks that shuffle Python syntax around mostly do not.
Memory: tracemalloc
Time is not the only cost. normalize builds one big string of all words and then a list from it. tracemalloc measures what Python allocated:
# mem.py
import tracemalloc
from collections import Counter
from wordfreq_slow import make_words, normalize

words = make_words()

tracemalloc.start()
counts = Counter(normalize(words))            # builds one big string, then a list
cur, peak = tracemalloc.get_traced_memory()
print(f"normalize + Counter : peak {peak/1e6:5.1f} MB")
tracemalloc.stop()

tracemalloc.start()
counts2 = Counter(w.lower() for w in words)   # streams one word at a time
cur, peak = tracemalloc.get_traced_memory()
print(f"generator + Counter : peak {peak/1e6:5.1f} MB")
assert counts == counts2

snap = tracemalloc.take_snapshot()
for stat in snap.statistics("lineno")[:3]:
    print(stat)
tracemalloc.stop()
normalize + Counter : peak  14.0 MB
generator + Counter : peak   0.4 MB
~/demo/mem.py:15: size=268 KiB, count=4986, average=55 B
.../python3.9/collections/__init__.py:679: size=144 KiB, count=1, average=144 KiB
.../python3.9/abc.py:123: size=1459 B, count=16, average=91 B
The streaming version peaks at 0.4 MB instead of 14 MB, and the snapshot shows what is still alive: 4,986 small strings (the distinct words kept as Counter keys) and the Counter's hash table. For a 2 GB log file this is the difference between working and being killed. Lecture 3 covers generators in detail.
Decision table
| Symptom | Tool / fix | Evidence above |
|---|---|---|
| "It's slow", no idea where | python -m cProfile -s tottime script.py |
One function was 95% of the time |
| Comparing two small snippets | python -m timeit -s setup stmt, take the min |
Results to 0.1 ms |
| Benchmark mutates its input | Copy inside the timed statement | data.sort() was 58× too optimistic |
x in big_list inside a loop |
set or dict |
4,253 ms → 3.9 ms |
| Deduplicate keeping order | list(dict.fromkeys(items)) |
4.03 ms, same order as the list version |
| Counting items | Counter(iterable) |
6.27 ms vs 13.18 ms hand-written |
| Building a string in an attribute or container | Collect in a list, "".join once |
2,949 ms → 17.7 ms |
| Hot inner loop over builtins | Comprehension or map(builtin, …) |
162 → 139 / 93 ms |
| Memory grows with input | tracemalloc, then generators |
14.0 MB → 0.4 MB |
| Still too slow after all this | Move work to C (NumPy, built-ins) or a process pool | See lecture 5 |
Honest limits / version notes
- All timings are Python 3.9.6 on an Apple M1 Pro, with other jobs running on the machine;
timeitminima of 5 repeats and medians of 5 runs. Absolute numbers will differ on your machine; the ratios are what to compare. - Python 3.11's "Faster CPython" work was not measured. The 3.11 release notes claim CPython 3.11 is on average about 1.25× faster than 3.10 on the pyperformance suite. Our only 3.11 is an x86_64 build running under Rosetta 2, so timing it would measure the translator, not the interpreter. Some of the gaps above (for example
i ** 2vsi * i, or the global-lookup cost) may be smaller on 3.11+; we cannot say by how much. - The in-place
str +=optimization is a CPython implementation detail, observed here on 3.9. PyPy and other implementations do not promise it. dict.fromkeyskeeps insertion order because dicts are ordered (guaranteed since 3.7).- cProfile numbers include profiler overhead;
make_wordsshowed 0.159 s under the profiler and 81.7 ms undertimeit.
Previous: Lecture 5: Threads, processes, asyncio and the GIL · Back to the start: Lecture 1: Types and mutability
Related: Generators and memory (lecture 3) · Java JIT, GC and memory · Sorting algorithms
FAQ
What should I optimize first in slow Python code?
Whatever cProfile says. In our word-count program one function, a list-membership dedupe, took 3.93 of 4.15 profiled seconds. Changing it to a set took the whole program from 4.39 s to 56 ms. The string concatenation everyone warns about was 0.04 s of the total.
Is d.get(key, 0) + 1 faster than 'if key in d'?
No, in our measurement on Python 3.9 it was slightly slower: 13.77 ms vs 13.18 ms for 200,000 words. defaultdict(int) took 10.53 ms, and Counter(words) 6.27 ms because its counting loop is written in C.
Is str += in a loop really quadratic?
For a local variable, no: CPython resizes the string in place, and 200,000 appends took 17.7 ms. For an attribute (self.text += ...) that optimization does not apply, and the same work took 2,949 ms, quadrupling each time the input doubled.