k-means in Pure Python: Local Minima and k-means++
k-means in stdlib Python, 200 runs per setup: random init found the best result 79/200, k-means++ 127/200. Empty clusters, scaling, k, real posts.
This post is for developers who call KMeans(n_clusters=…) and want to know what it does when things go wrong. We wrote k-means in about 60 lines of standard-library Python and ran it 200 times per setup. Random starts found the best clustering in only 79 of 200 runs; k-means++ found it in 127 of 200 and converged in 7.3 iterations instead of 10.0. Python also let an empty cluster turn into a silent "ghost" centroid instead of raising an error.
This is lecture 2 of the series Machine learning from scratch (Python stdlib only). Lecture 1 fitted a line with gradient descent: a loss, a loop and a stopping rule. k-means has the same three parts, but there are no labels and no gradient. Later lectures cover naive Bayes, the perceptron and a small neural network and a TF-IDF/BM25 search engine.
Environment: Python 3.9.6 standard library only (math, random, statistics, collections, re), Apple Silicon Mac (M1 Pro). There are no deprecated APIs, so the code should also run on Python 3.12+. Every random number comes from a seeded random.Random, so the numbers below should reproduce exactly.
Lloyd's algorithm in 60 lines
k-means looks for k points, the centroids, that minimize inertia: the sum of squared distances from every point to its nearest centroid. The standard method is Lloyd's algorithm. It alternates two steps until nothing changes:
- Assign each point to its nearest centroid.
- Update each centroid to the mean of the points assigned to it.
Neither step can increase inertia, so the loop always stops. But it stops at the first point where neither step helps. That is a local minimum, and most of this post is about that difference.
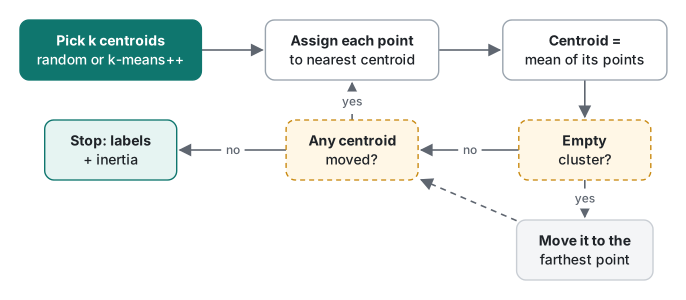
Here is the whole module, kmeans.py. The other scripts import it.
import math, random

def make_blobs(centers, n_each, spread, seed):
    rng = random.Random(seed)
    X, y = [], []
    for label, (cx, cy) in enumerate(centers):
        for _ in range(n_each):
            X.append((rng.gauss(cx, spread), rng.gauss(cy, spread)))
            y.append(label)
    return X, y

def d2(a, b):
    return sum((p - q) ** 2 for p, q in zip(a, b))

def mean(points):
    n = len(points)
    return tuple(sum(c) / n for c in zip(*points))

def init_random(X, k, rng):            # Forgy: k distinct data points
    return [X[i] for i in rng.sample(range(len(X)), k)]

def init_plusplus(X, k, rng):          # k-means++ (Arthur & Vassilvitskii 2007)
    C = [X[rng.randrange(len(X))]]
    D = [d2(x, C[0]) for x in X]
    while len(C) < k:
        r, acc = rng.random() * sum(D), 0.0
        for i, w in enumerate(D):
            acc += w
            if acc >= r:
                break
        C.append(X[i])
        D = [min(D[j], d2(X[j], X[i])) for j in range(len(X))]
    return C

def kmeans(X, k, init="++", seed=0, max_iter=300, C=None):
    rng = random.Random(seed)
    if C is None:
        C = (init_plusplus if init == "++" else init_random)(X, k, rng)
    empty_fixes = 0
    for it in range(1, max_iter + 1):
        # 1) assignment step
        labels = [min(range(k), key=lambda j: d2(x, C[j])) for x in X]
        # 2) update step
        groups = [[] for _ in range(k)]
        for x, j in zip(X, labels):
            groups[j].append(x)
        newC = []
        for j in range(k):
            if groups[j]:
                newC.append(mean(groups[j]))
            else:   # empty cluster: move it to the worst-served point
                far = max(range(len(X)), key=lambda i: d2(X[i], C[labels[i]]))
                newC.append(X[far])
                empty_fixes += 1
        if newC == C:
            break
        C = newC
    inertia = sum(d2(x, C[j]) for x, j in zip(X, labels))
    return C, labels, inertia, it, empty_fixes
The it value counts the final pass that confirmed nothing moved. The test data is 8 Gaussian blobs of 75 points each (σ = 1.0) on a grid with 6 units between centers, so there are 600 points with seed 42. With σ = 1 and a gap of 6 the blobs barely touch, so the right answer is obvious to a human eye. That makes the failures below easy to see.
What goes wrong 1: random starts land in bad local minima
The script runs each initialization with seeds 0 to 199 and looks at the distribution of final inertia, not a single run:
import statistics as st, time
from kmeans import make_blobs, kmeans

CENTERS = [(0,0),(6,0),(12,0),(0,6),(6,6),(12,6),(3,12),(9,12)]
X, y = make_blobs(CENTERS, n_each=75, spread=1.0, seed=42)

for init in ("random", "++"):
    t = time.perf_counter()
    runs = [kmeans(X, 8, init=init, seed=s) for s in range(200)]
    sec = time.perf_counter() - t
    inert = [r[2] for r in runs]; iters = [r[3] for r in runs]
    best = min(inert)
    q = st.quantiles(inert, n=4)
    print(f"{init:>6}: inertia best {best:.1f} | Q1 {q[0]:.1f} median {q[1]:.1f} "
          f"Q3 {q[2]:.1f} worst {max(inert):.1f}")
    print(f"        runs at best {sum(i < best * 1.001 for i in inert)}/200, "
          f"distinct end states {len({round(i) for i in inert})}, "
          f"iterations mean {st.mean(iters):.1f} max {max(iters)}, {sec:.2f}s")
    tens = [min(inert[i:i + 10]) for i in range(0, 200, 10)]
    print(f"        best-of-10 restarts reached the best in "
          f"{sum(b < best * 1.001 for b in tens)}/20 groups")
random: inertia best 1170.9 | Q1 1170.9 median 2275.3 Q3 2413.8 worst 3765.7
        runs at best 79/200, distinct end states 81, iterations mean 10.0 max 29, 5.35s
        best-of-10 restarts reached the best in 20/20 groups
    ++: inertia best 1170.9 | Q1 1170.9 median 1170.9 Q3 2289.9 worst 2592.9
        runs at best 127/200, distinct end states 57, iterations mean 7.3 max 23, 4.44s
        best-of-10 restarts reached the best in 20/20 groups
With random starting points, the median run is about twice as bad as the best (2,275 against 1,171). The 200 runs ended in 81 different states. When we looked at what a bad run contained, it was always the same shape. Seed 2, for example, put blobs 6 and 7 under one centroid (144 points) and split blob 2 into two clusters of 42 and 33. Neither step of Lloyd's algorithm can fix that. Moving one centroid across the gap would first make inertia worse, and the algorithm never takes a step that does.
k-means++ picks the first centroid at random. It picks each following one with probability proportional to its squared distance from the nearest centroid already chosen. Far-away blobs are therefore likely to get a centroid of their own. It reached the best state in 127 of 200 runs and needed 2.7 fewer iterations on average. Its worst run (2,593) was also much better than random's worst (3,766). Even so, k-means++ failed 73 times in 200. It is a better start, not a guarantee.
The fix that works with either method is boring: run it several times and keep the lowest inertia. Split into 20 groups of 10 seeds, the best of each group was the global best in 20 of 20 groups for both methods. That is the reason for scikit-learn's n_init option. Note that its current default, n_init="auto", runs k-means++ only once. On this data a single k-means++ run missed the best state 36.5% of the time, so set n_init yourself when the result matters.

The middle bar in the figure comes from the next section. It is a third way to start: k random points anywhere in the data's bounding box.
What goes wrong 2: empty clusters (and a silent Python trap)
A cluster becomes empty when no point is closer to its centroid than to some other centroid. If every centroid starts on a data point (random or k-means++), each one keeps at least that point in the first round. In our 400 runs of those two methods an empty cluster never occurred. Start from random coordinates in the bounding box, though, and some centroids land in empty space between blobs.
We expected the textbook loop to crash with ZeroDivisionError. It did not:
import random
from kmeans import make_blobs, kmeans, mean, d2
CENTERS = [(0,0),(6,0),(12,0),(0,6),(6,6),(12,6),(3,12),(9,12)]
X, _ = make_blobs(CENTERS, n_each=75, spread=1.0, seed=42)
lo = [min(c) for c in zip(*X)]; hi = [max(c) for c in zip(*X)]

def box_init(seed, k=8):        # k random points anywhere in the bounding box
    rng = random.Random(seed)
    return [tuple(rng.uniform(a, b) for a, b in zip(lo, hi)) for _ in range(k)]

print("mean([]) =", mean([]), "  d2((3, 4), ()) =", d2((3.0, 4.0), ()))

def naive(C, k=8):              # textbook loop, no empty-cluster handling
    for it in range(1, 301):
        labels = [min(range(k), key=lambda j: d2(x, C[j])) for x in X]
        newC = [mean([x for x, l in zip(X, labels) if l == j]) for j in range(k)]
        if newC == C: break
        C = newC
    return C, it
…
mean([]) = ()   d2((3, 4), ()) = 0
naive: no exception, ghost centroid in 36 of 200 runs
  iterations of those runs: [300] | real centroids left: [1]
with reseeding: 36 runs needed a fix, 101 of 200 reached inertia 1170.9
zip(*[]) yields nothing, so the mean of an empty cluster is the empty tuple () and the division never runs. Then zip(point, ()) also yields nothing, so the distance from every point to that ghost is 0. In the next round the ghost captures all 600 points, the other centroids empty out and become ghosts too, and the loop swaps between those states until the 300-iteration cap. In all 36 affected runs, one real centroid was left. Nothing raised. A numpy version fails differently (the mean of an empty array is nan with a warning; we did not run that here). Either way, handle the case explicitly.
We compared two repairs on those 36 runs:
| Handling | Result on the 36 runs with an empty cluster |
|---|---|
| None (naive loop) | No error; ghost centroid, 300 iterations, 1 real centroid left |
| Drop the empty centroid | Converged, but ended with k = 6 or 7; median inertia 2,422.2 |
| Move it to the point farthest from its centroid | k stays 8; median inertia 1,170.9 (the best) |
Moving the empty centroid to the worst-served point is what kmeans.py does. It gives the centroid work where inertia is highest. Dropping it quietly changes the k you asked for, which is worse than an error. A surprise: with the repair in place, the bounding-box start reached the best state in 101 of 200 runs, more often than random data points (79). We would not generalize from one data set, but "random points are worse than k-means++" held in every comparison we made.
What goes wrong 3: features on different scales
k-means measures plain Euclidean distance, so a feature with a large numeric range dominates. We made 600 "users" from two real groups that differ only in session length (2 vs 8 minutes, σ 0.7). We added a second feature, bytes downloaded, that is pure noise around 50,000 (σ 15,000):
def ari(a, b):                         # adjusted Rand index, stdlib only
    c2 = lambda n: n * (n - 1) / 2
    nij = sum(c2(v) for v in Counter(zip(a, b)).values())
    ai = sum(c2(v) for v in Counter(a).values())
    bj = sum(c2(v) for v in Counter(b).values())
    exp = ai * bj / c2(len(a))
    return (nij - exp) / ((ai + bj) / 2 - exp)

rng = random.Random(7)
X, y = [], []
for label, minutes in enumerate((2.0, 8.0)):    # two real user groups
    for _ in range(300):
        X.append((rng.gauss(minutes, 0.7),       # session minutes: the signal
                  rng.gauss(50000, 15000)))      # bytes downloaded: pure noise
        y.append(label)

def zscore(X):
    cols = list(zip(*X))
    mu = [st.mean(c) for c in cols]; sd = [st.pstdev(c) for c in cols]
    return [tuple((v - m) / s for v, m, s in zip(x, mu, sd)) for x in X]
…
     raw: ARI vs truth -0.001  sizes [247, 353]
 z-score: ARI vs truth 0.005  sizes [248, 352]
--- 50 seeds each ---
     raw: ARI>0.9 in 0/50 seeds, lowest-inertia run ARI -0.001
 z-score: ARI>0.9 in 46/50 seeds, lowest-inertia run ARI 1.000
     raw: inertia of true groups 1.394e+11, k-means best 5.423e+10
 z-score: inertia of true groups 630.7, k-means best 630.7
The adjusted Rand index (ARI) is 1 for a perfect match with the true groups and about 0 for a random split. On raw data k-means split the noise in all 50 seeds. The last two lines show why: on raw data the true grouping has 2.6 times the inertia of the noise split. k-means minimized the objective correctly; the objective was wrong. No number of restarts fixes that.
After z-scoring each column, the true split is the global minimum. Note the first z-score line, though: seed 0 still fell into the noise split (ARI 0.005). Over 50 seeds, 46 found the true groups, and keeping the lowest inertia picked one of them. Scaling and restarts solve different problems, and you need both. Also, z-scoring gives a pure-noise column the same weight as the signal. Here the signal was strong enough. With five noise columns it might not be, and then the answer is choosing features, not tuning k-means.
Choosing k: elbow and silhouette in stdlib
Inertia always goes down as k grows, so the minimum cannot choose k. Two common heuristics:
- Elbow: plot inertia against k and look for the bend after which adding clusters stops paying off.
- Silhouette: for each point, a is the mean distance to the other points in its own cluster and b the mean distance to the nearest other cluster. The score is s = (b − a) / max(a, b). The mean over all points ranges from −1 to 1, and higher means tighter, better-separated clusters.
def silhouette(X, labels):
    k = max(labels) + 1
    total = 0.0
    for i, x in enumerate(X):
        sums, cnt = [0.0] * k, [0] * k
        for p, l in zip(X, labels):
            sums[l] += math.dist(x, p); cnt[l] += 1
        own = labels[i]
        if cnt[own] == 1:
            continue                      # singleton: s = 0 by convention
        a = sums[own] / (cnt[own] - 1)    # distance to itself is 0, not counted
        b = min(sums[j] / cnt[j] for j in range(k) if j != own and cnt[j])
        total += (b - a) / max(a, b)
    return total / len(X)

for k in range(2, 11):
    best = min((kmeans(X, k, seed=s) for s in range(10)), key=lambda r: r[2])
    …
k= 2 inertia  16057.9 drop         silhouette 0.357
k= 3 inertia   8662.2 drop  46.1%  silhouette 0.437
…
k= 6 inertia   3639.7 drop  25.9%  silhouette 0.522
k= 7 inertia   2319.1 drop  36.3%  silhouette 0.584
k= 8 inertia   1170.9 drop  49.5%  silhouette 0.661
k= 9 inertia   1102.9 drop   5.8%  silhouette 0.619
k=10 inertia   1049.7 drop   4.8%  silhouette 0.567
2.3s
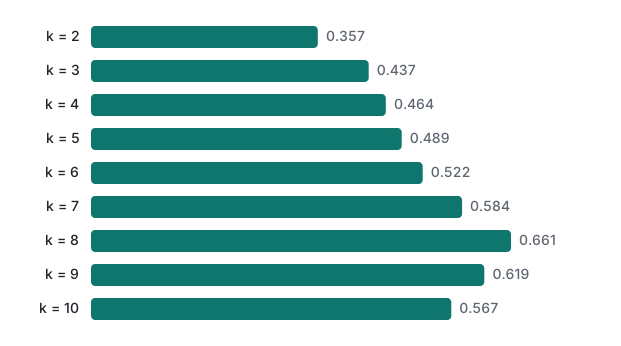
On this data both agree. Going from 7 to 8 clusters removes 49.5% of the inertia and 8 to 9 only 5.8%: that is the elbow. The silhouette peaks at 0.661 for k = 8. Silhouette costs O(n²) distance computations per k, which is fine for 600 points (2.3 s for all nine values of k, including the clustering) and slow at 50,000.
Then we widened the blobs to σ = 2.0 with everything else unchanged:
k= 2 inertia  18150.6 drop         silhouette 0.344
k= 3 inertia  10271.1 drop  43.4%  silhouette 0.407
k= 4 inertia   7917.2 drop  22.9%  silhouette 0.377
…
k= 8 inertia   3468.8 drop  17.2%  silhouette 0.399
k= 9 inertia   3174.6 drop   8.5%  silhouette 0.390
k=10 inertia   2908.6 drop   8.4%  silhouette 0.373
The data still came from 8 blobs, but the silhouette now prefers k = 3 (0.407). The drops (23%, 22%, 20%, 16%, 17%) give no clear elbow. When clusters overlap this much, both methods measure how well separated a partition is, not how many generators there were. In practice, use them to shortlist two or three values of k, then look at what is actually in the clusters.
Bonus: clustering this blog's own posts
Real text is less tidy than blobs. We took a snapshot of the 86 English posts on this blog (content/en/*.md, taken before this series was added). Each post became a bag-of-words vector, with each word counted and the vector scaled to length 1. On unit vectors, squared Euclidean distance is 2 − 2·cosine, so nearest-centroid assignment roughly follows cosine similarity. We ran k = 9, one cluster per frontmatter category, and kept the lowest inertia of 20 k-means++ seeds:
def load(folder, drop_code):
    docs = []
    for f in sorted(Path(folder).glob("*.md")):
        text = f.read_text(encoding="utf-8")
        _, fm, body = text.split("---", 2)
        cat = re.search(r"^category:\s*([\w-]+)", fm, re.M).group(1)
        if drop_code:
            body = re.sub(r"```.*?```", " ", body, flags=re.S)
        words = [w for w in re.findall(r"[a-z][a-z0-9+#]{2,}", body.lower()) if w not in STOP]
        docs.append((f.stem, cat, Counter(words)))
    return docs

def vectors(docs, idf):
    N = len(docs)
    df = Counter(w for _, _, c in docs for w in c)
    vocab = sorted(w for w, n in df.items() if 2 <= n <= N // 2)
    vecs = []
    for _, _, c in docs:
        v = [c[w] * (math.log(N / df[w]) if idf else 1.0) for w in vocab]
        norm = math.sqrt(sum(x * x for x in v)) or 1.0
        vecs.append(tuple(x / norm for x in v))      # unit length -> cosine
    return vecs, len(vocab)
…
STOP is a list of 62 common English words. Words must appear in at least 2 and at most 43 posts. The four variants:
code kept    idf=False docs=86 vocab=3521 k=9 ARI=0.387 purity=0.779 (18.6s)
code kept    idf=True  docs=86 vocab=3521 k=9 ARI=0.380 purity=0.756 (15.4s)
code dropped idf=False docs=86 vocab=3195 k=9 ARI=0.331 purity=0.791 (17.0s)
code dropped idf=True  docs=86 vocab=3195 k=9 ARI=0.361 purity=0.744 (13.4s)
Purity counts each cluster's most common category as "correct". Putting every post into one cluster already scores 37/86 = 0.43, because 37 posts are C#. The honest summary: the agreement with our categories is moderate (ARI 0.33 to 0.39). IDF weighting and removing code blocks did not help in any consistent way. Across the 20 seeds of the first variant, ARI ranged from 0.17 to 0.45. The lowest-inertia run (0.387) was not the one that agreed best with the categories. Inertia does not know what our categories are.
What ended up together (lowest-inertia run, first variant, lists shortened):
| Cluster | Size | Categories inside | Examples |
|---|---|---|---|
| A | 18 | csharp 17, algorithm 1 | csharp-linq-basics, csharp-generics, csharp-lambda-expression, … algorithm-sorting |
| B | 16 | server 6, app-ops 4, web 3, flutter 2, ai 1 | mysql-max-connections-per-hour-shared-hosting, flutter-migration-16-apps-what-broke, ai-coding-agent-live-server-guardrails, … |
| C | 12 | csharp 12 | csharp-class, csharp-interface, csharp-event, csharp-struct, … |
| D | 9 | regex 9 | all nine regex posts, nothing else |
| E | 9 | algorithm 9 | data-structure-heap, data-structure-tree, algorithm-dfs-depth-first-search, … |
| F | 7 | winapi 5, csharp 1, algorithm 1 | winapi-sendmessage, winapi-findwindow, csharp-registry, algorithm-binary-search |
| G | 7 | csharp 5, winapi 1, algorithm 1 | winforms-modal-modeless-form, winforms-ok-cancel-button, csharp-file-io, … |
| H | 5 | algorithm 3, csharp 2 | csharp-collection-basics, data-structure-circular-queue, data-structure-linked-queue, … |
| I | 3 | server 1, web 1, ai 1 | og-image-cards-pillow-cjk-line-breaking, hosting-account-migration-what-broke, … |
Several of the "errors" are arguably better than our labels. The 37 C# posts split into syntax and LINQ (A) and object-oriented features (C). The WinForms posts are filed under csharp but cluster with Win32 window handling (G and F). The queue and collection posts (H) share a vocabulary whichever language they use. On the other hand, the 16 operations posts (B) fall into one lump of servers, apps and PHP, because the categories server, app-ops, web and flutter overlap heavily in wording. That matches the naive Bayes lecture, which used labels and still scored 0 of 12 on the four smallest categories. If you need the categories back, train a classifier. If you want to discover structure your labels hide, k-means on word vectors is a cheap first look.
When to use k-means, and when not to
| Your situation | Use | Why |
|---|---|---|
| Roughly round clusters of similar size, numeric features, k known or shortlistable | k-means (k-means++, several restarts) | Fast, simple, and the result is a centroid you can explain |
| Clusters shaped like rings, moons or long strands | DBSCAN, HDBSCAN, spectral clustering | k-means draws straight boundaries halfway between centroids, so it cuts curved shapes |
| Strong outliers you cannot remove | k-medoids (PAM), DBSCAN (marks noise) | A mean is pulled by one extreme point; a medoid is not |
| You do not know k, and density varies | HDBSCAN | It chooses the number of clusters from density |
| Clusters of very different spread or size | Gaussian mixture model | k-means assumes equal, round spread; a GMM learns a shape per cluster |
| You need "70% A, 30% B" membership | Gaussian mixture model, fuzzy c-means | k-means assigns each point to exactly one cluster |
| Categorical columns (country, plan, OS) | k-modes, k-prototypes | The mean of category codes is meaningless |
| Millions of rows | Mini-batch k-means | Each update uses a sample instead of all points |
| Text | Spherical k-means on TF-IDF or embeddings, or topic models | The direction of a vector matters more than its length |
We only named the alternatives here; this post does not implement or measure them.
Honest limits
- One synthetic data set. The 79 vs 127 result depends on our 8 blobs at σ = 1.0. With fewer, better-separated clusters random starts do much better. With many close clusters both methods do worse. The shape of the result (k-means++ is better on average and still fails sometimes) is well documented. The exact ratio is ours alone.
- Our convergence test is exact equality of centroid tuples (
newC == C). With floats it does settle on data this small, but production code should stop when the shift is below a tolerance.max_iteris the safety net. - The empty-cluster repair is simple. If two clusters are empty in the same iteration, both get the same farthest point. That never happened in our runs, but a robust version would choose distinct points.
- Pure Python is slow. One run on the 86 posts (3,521 dense dimensions) took about 0.9 s, and silhouette is O(n²). This code is for understanding. For real data, use a library with sparse vectors.
- The blog experiment is small and judges against a human label. With 86 posts and categories of 2 to 37 posts, one moved post changes ARI visibly. "Agreement with our categories" is also not the same as "good clusters". Clusters F and G above show k-means finding a grouping we would defend.
- Elbow and silhouette are heuristics. At σ = 2.0 the silhouette chose 3 for data generated from 8 blobs. Neither replaces a look at what is inside the clusters.
Next in the series: a naive Bayes text classifier on the same 86 posts, this time with labels. If you liked counting comparisons and iterations, the measured sorting comparison in C uses the same approach.
FAQ
Why does k-means give a different result every time I run it?
Because it only finds a local minimum, and which one depends on the starting centroids. On 600 points in 8 blobs, random starting points reached the best inertia (1,170.9) in 79 of 200 seeds and ended in 81 different states. k-means++ reached it in 127 of 200. Keeping the best of 10 restarts reached it in 20 of 20 groups with either method.
What should k-means do when a cluster becomes empty?
Repair it, for example by moving that centroid to the point farthest from its own centroid. In Python the mean of an empty list can silently return an empty tuple instead of raising an error. In our test that ghost centroid took over in 36 of 200 runs, which then never converged.
How do I choose k for k-means?
Compute inertia (elbow) and the mean silhouette score for a range of k and look at both. On well-separated data both pointed to the true k = 8 (silhouette 0.661). With wider blobs the elbow had no clear bend and the silhouette peaked at k = 3, so treat both as hints.