PHP OPcache, JIT and Profiling on PHP 8.5, Measured
OPcache slowed the CLI but made server requests 35× faster; the JIT gave 4.5× on math and 8% on string work. Plus a 900× concat trap and generators.
Series: PHP lecture 6/6 (advanced). For developers whose PHP code works and who now want to know where the time and memory go. After this lecture you can turn OPcache and the JIT on where they help (and know where they do not), measure with hrtime without installing a profiler, read the opcodes PHP actually runs, and spot the handful of loop patterns that cost 100× more than they should.
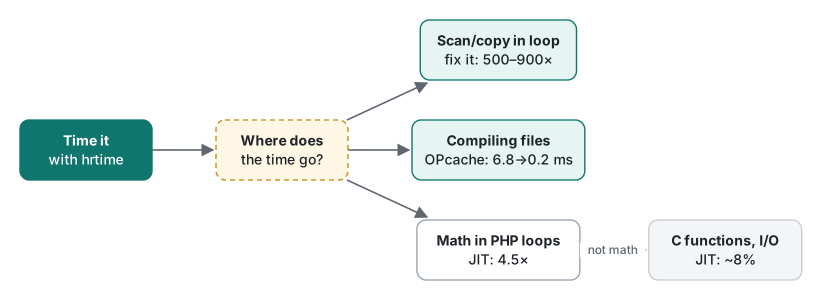
If a PHP page or batch job is "slow" and the first suggestion you hear is "turn on the JIT", this lecture is for you. On our measurements the JIT gave 4.5× on pure arithmetic and 8% on typical web work, while one rewritten line of string building gave almost 900×. Every number below was measured on the machine described next; where a measurement fooled us (a benchmark that ran without OPcache because the file was too new), we kept it.
Environment: PHP 8.5.6 CLI (NTS) with Zend OPcache, Apple Silicon Mac (M1 Pro), macOS, memory_limit=128M. No xdebug, SPX, xhprof or Blackfire is installed, and this lecture installs nothing: all timing uses hrtime(). Medians are given with the number of runs. Paths in output are shortened to ~/demo/.
Profiling without extensions: hrtime and checking what you measure
hrtime(true) returns a monotonic nanosecond counter as an integer. Unlike microtime(true), it never jumps when the system clock is adjusted and has no float rounding. This helper ran every in-process benchmark in this lecture:
<?php
// one warm-up call, then the median of 5 rounds
function bench(string $name, callable $fn, int $rounds = 5): void {
    $fn();                                            // warm-up round, discarded
    $t = [];
    for ($r = 0; $r < $rounds; $r++) { $s = hrtime(true); $res = $fn(); $t[] = (hrtime(true) - $s) / 1e6; }
    sort($t);
    printf("%-34s %8.2f ms   (%s)\n", $name, $t[intdiv($rounds, 2)], is_scalar($res) ? $res : count($res));
}
It prints the result too: if two variants return different values, you are comparing different work. A real profiler (xdebug's profiler, SPX, Blackfire) shows which function is slow without you guessing. None is installed here, so the method is: time a whole request, then bisect with hrtime around suspects.
PHP also ships a way to see what it really executes. opcache.opt_debug_level dumps the opcodes before (0x10000) and after (0x20000) the optimizer:
function f(array $a): int {
    $n = 0;
    for ($i = 0; $i < count($a); $i++) $n += strlen("hello") * 2;
    return $n;
}
$ php -d opcache.enable_cli=1 -d opcache.opt_debug_level=0x20000 ops.php
f:
     ; (after optimizer)
0004 CV1($n) = ADD CV1($n) int(10)
0005 PRE_INC CV2($i)
0006 T4 = COUNT CV0($a)
0007 T3 = IS_SMALLER CV2($i) T4
0008 JMPNZ T3 0004
strlen("hello") * 2 became the constant int(10) already in the before dump: the compiler folds it. A benchmark of "how fast is strlen" written like that measures an addition. And count() is not a function call at all but a single COUNT opcode, which matters in the next section.
OPcache on the CLI vs on a server
OPcache stores compiled opcodes in shared memory so the next request skips parsing and compiling. On the CLI it is off by default (opcache.enable_cli => Off), and that is deliberate. We generated a 437 KB file with 2,000 small classes and timed 20 fresh php processes (after one discarded run) per setting:
empty script                 median   56.1 ms
opcache.enable_cli=0         median   64.7 ms   last line: M1999-05998 loaded 2000 classes in 7.78 ms
opcache.enable_cli=1         median   75.7 ms   last line: M1999-05998 loaded 2000 classes in 17.49 ms
enable_cli=1 + file_cache    median   58.3 ms   last line: M1999-05998 loaded 2000 classes in 1.74 ms
The other two sets of 20 runs gave 63.9/75.3/58.2 and 64.3/74.5/58.2 ms. With enable_cli=1 the CLI got slower: each process runs the optimizer, fills a cache, and exits, so nothing is ever reused. opcache.file_cache=<dir> with opcache.file_cache_only=1 writes the compiled code to disk, and later processes loaded the 2,000 classes in 1.74 ms instead of 7.78 ms. Note the 56 ms floor: starting this PHP build, with 67 extensions loaded, costs more than our whole script.
A server is the opposite case. The built-in server is one long-lived process, and opcache.enable applies to it. 300 sequential requests with ext/curl, the first discarded:
| Built-in server | Median | p95 | Load time inside the script |
|---|---|---|---|
opcache.enable=0 |
6.79 ms (6.95 on a 2nd run) | 7.43 ms | 6.31 ms |
opcache.enable=1 |
0.18 ms (0.20) | 0.26 ms | 0.01 ms |
opcache_get_status() afterwards: hits=1198 misses=3 cached_scripts=3. About 35× per request, almost all of it compile time. PHP-FPM and Apache's mod_php behave like the second row, which is why OPcache should simply be on in production.
The JIT: a CPU-bound benchmark
Since PHP 8.0, OPcache contains a JIT compiler that turns hot opcodes into machine code. On 8.5 it is off by default (opcache.jit => disable, opcache.jit_buffer_size => 64M). The test is a 600×600 Mandelbrot with at most 200 iterations per pixel: pure floating-point arithmetic in PHP loops.
<?php
// mandel.php — CPU-bound: 600x600 Mandelbrot, 200 iterations max. Prints a checksum.
declare(strict_types=1);
function mandel(int $w, int $h, int $maxIter): int {
    $inside = 0;
    for ($y = 0; $y < $h; $y++) {
        $ci = 2.0 * $y / $h - 1.0;
        for ($x = 0; $x < $w; $x++) {
            $cr = 3.0 * $x / $w - 2.0;
            $zr = 0.0; $zi = 0.0; $i = 0;
            while ($i < $maxIter && $zr * $zr + $zi * $zi < 4.0) {
                $t = $zr * $zr - $zi * $zi + $cr;
                $zi = 2.0 * $zr * $zi + $ci;
                $zr = $t;
                $i++;
            }
            if ($i === $maxIter) $inside++;
        }
    }
    return $inside;
}
$t = hrtime(true);
$r = mandel(600, 600, 200);
printf("mandel %d  %.1f ms\n", $r, (hrtime(true) - $t) / 1e6);
Five fresh processes per configuration, timer inside the script, every run printed the same checksum 91677:
| Flags | Median | Min–max |
|---|---|---|
opcache.enable_cli=0 |
524.7 ms | 524.4–525.5 |
enable_cli=1, jit=disable |
334.4 ms | 333.6–338.7 |
jit=tracing, jit_buffer_size=0 |
333.2 ms | 332.8–333.8 |
jit=tracing, buffer 64M |
75.0 ms | 74.6–76.4 |
jit=function, buffer 64M |
74.1 ms | 73.9–74.9 |
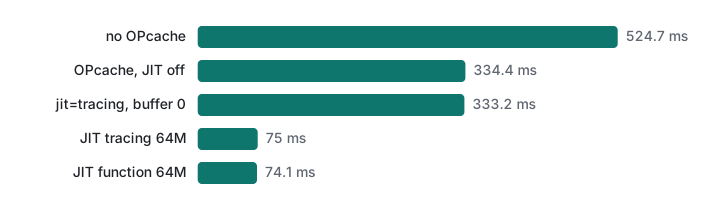
Three findings. OPcache alone made the loop 1.6× faster, because its optimizer infers types and uses specialised opcodes. The JIT added another 4.5×. And jit=tracing with a zero buffer silently did nothing. opcache_get_status(false)['jit'] tells you the truth:
-d opcache.jit=tracing                              → opcache_get_status: false
-d opcache.enable_cli=1 -d opcache.jit=tracing      → jit enabled=true on=true kind=5 buffer=67108848
... -d opcache.jit_buffer_size=0                    → jit enabled=false on=false kind=5 buffer=0
-d opcache.enable_cli=1 -d opcache.jit=bogus
PHP Warning:  Invalid "opcache.jit" setting. Should be "disable", "on", "off", "tracing", "function" or 4-digit number in Unknown on line 0
Without enable_cli=1, the JIT setting has no effect at all on the CLI, and only a typo produces a warning. Tracing and function JIT tied on this single hot function; tracing usually wins when hot paths span several functions.
The JIT on string and array work
Most PHP time goes to building arrays, calling json_encode, sorting and string functions, and those run as C code inside PHP whether or not the JIT is on:
<?php
// strwork.php — "web-ish" work: build rows, json_encode, explode, str_replace, sort.
declare(strict_types=1);
mt_srand(42);
$t = hrtime(true);
$total = 0;
for ($round = 0; $round < 40; $round++) {
    $rows = [];
    for ($i = 0; $i < 5000; $i++) {
        $rows[] = ['id' => $i, 'name' => 'user_' . mt_rand(1, 99999), 'tags' => 'a,b,c,' . ($i % 7)];
    }
    $json = json_encode($rows);
    $back = json_decode($json, true);
    usort($back, fn($a, $b) => strcmp($a['name'], $b['name']));
    foreach ($back as $r) {
        $total += count(explode(',', $r['tags'])) + strlen(str_replace('user_', 'u:', $r['name']));
    }
}
printf("strwork %d  %.1f ms\n", $total, (hrtime(true) - $t) / 1e6);
| Flags | Median of 5 | Min–max |
|---|---|---|
| no OPcache | 261.5 ms | 254.1–267.6 |
| OPcache, JIT off | 261.2 ms | 260.2–267.5 |
| JIT tracing | 240.2 ms | 234.9–245.0 |
| JIT function | 244.7 ms | 241.0–258.0 |
About 8%, and the min–max ranges almost touch. A typical page that queries a database and renders a template will see less, because waiting on I/O does not speed up at all. The JIT is worth enabling for image processing, math, parsers written in PHP; for a CRUD app, OPcache is the win and the JIT is noise.
Memory: arrays vs generators on 1M items
memory_get_peak_usage() after summing one million integers, each mode in a fresh process, measured relative to the usage before the loop:
function numbers(int $n): Generator { for ($i = 0; $i < $n; $i++) yield $i; }
// 'array': $a = range(0, $n - 1); foreach ($a as $v) $sum += $v;
// 'gen':   foreach (numbers($n) as $v) $sum += $v;
| 1,000,000 items | Peak increase | Time |
|---|---|---|
range() array of ints |
16.0 MB | 7 ms |
generator (yield) |
0.0 MB | 22 ms |
["k$i" => $i] string keys |
76.0 MB | 66 ms |
["row-$i", …] strings |
54.2 MB | 45 ms |
[['id' => $i, 'v' => …], …] rows |
Fatal at 128M; 374.6 MB with 1G | 185 ms |
A packed integer array costs 16 bytes per element; a generator holds one value at a time but was 3× slower here, because every yield resumes a function. String keys add a hash table and a string per key. The row-per-array case is what a "fetch all rows" query builds, and under the default limit it died:
PHP Fatal error: Allowed memory size of 134217728 bytes exhausted (tried to allocate 20480 bytes) in ~/demo/mem.php on line 13
Generators are the tool for streaming large inputs (a CSV, a cursor over PDOStatement::fetch()), where they turn "out of memory" into "constant memory". For small arrays that already fit, an array is faster.
Common slow patterns, measured
slow.php ran each pattern with the bench() helper, median of 5 after one warm-up, first without OPcache (the CLI default), then with OPcache and the tracing JIT:
| Pattern | No OPcache | OPcache + JIT |
|---|---|---|
for with count($data) in the condition, 1M |
7.55 ms | 1.13 ms |
count() hoisted into a variable |
6.54 ms | 1.02 ms |
foreach |
5.24 ms | 1.89 ms |
$s .= $piece, 200k pieces |
8.96 ms | 8.33 ms |
$s = $s . $piece, 200k pieces |
7,961 ms | 7,619 ms |
$s = $piece . $s, 20k pieces |
66.70 ms | 95.60 ms |
implode() of an array, 200k |
9.85 ms | 9.96 ms |
in_array 10k needles in 10k strings |
232.51 ms | 224.93 ms |
array_flip once + isset 10k times |
0.37 ms | 0.26 ms |
in_array, a single lookup |
0.04 ms | 0.04 ms |
array_flip + isset, a single lookup |
0.08 ms | 0.09 ms |
$all = array_merge($all, $chunk), 2k × 50 |
227.13 ms | 224.18 ms |
array_push($all, ...$chunk) |
1.06 ms | 1.10 ms |
collect chunks, one array_merge(...$parts) |
0.46 ms | 0.46 ms |
count() in the loop condition is the most repeated performance tip and the least important one here: 1 ms over a million iterations, because count() is an O(1) opcode (the dump above). Hoist it for readability if you like. Under the JIT, foreach was the slowest of the three, a reminder that folklore from PHP 5 does not survive measurement.
String concatenation is where the real trap is.
Common mistake: $s = $s . $x in a loop
The mistake: writing the long form of append, often when the line also does something else, such as $html = $html . render($row);.
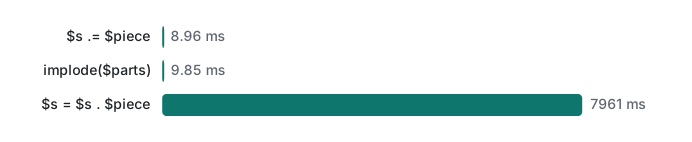
What actually happens: each iteration creates a new string and copies everything built so far. 200,000 pieces took 7,961 ms instead of 8.96 ms, almost 900×, and it grows with the square of the size:
n= 25000  s=s.x     91.6 ms   s.=x  1.00 ms
n= 50000  s=s.x    296.6 ms   s.=x  2.06 ms
n=100000  s=s.x   1141.0 ms   s.=x  4.10 ms
Doubling n made it 3.2–3.8× slower; .= grew linearly, because PHP can extend the string in place when it owns the only reference. Prepending ($s = $piece . $s) is quadratic too. The JIT did not help (7,619 ms).
The fix: .=, or collect pieces in an array and implode() once. Both took about 9 ms.
in_array vs isset on a flipped array. in_array scans the array, so 10,000 lookups in 10,000 items is 100 million comparisons in the worst case: 232 ms. Flipping once makes the values keys of a hash table, and each isset is a single hash lookup: 0.37 ms, 628× faster. But for a single lookup the flip costs more than it saves (0.08 vs 0.04 ms). Flip when you look up many times in the same array.
array_merge in a loop copies the growing array each time, the same quadratic shape: 227 ms vs 0.46 ms for collecting chunks and merging once.
Microbenchmarks that mislead (one fooled us)
To show JIT warm-up, we wrote a small file that calls mandel(150, 150, 200) six times, created it and ran it at once with opcache.jit=tracing:
call 1: 33.38 ms
call 2: 32.96 ms
...
call 6: 33.82 ms
Identical to JIT off. The JIT buffer had grown by about 1 KB. The cause was opcache.file_update_protection => 2: OPcache refuses to cache a file modified in the last 2 seconds (to avoid caching a half-written file), and without caching there is no JIT. Two seconds later, same command:
call 1: 5.16 ms
call 2: 4.72 ms
call 6: 4.70 ms
A benchmark script generated and run immediately, or edited and re-run within 2 seconds, measures PHP without OPcache. Other traps from this lecture:
- CLI defaults are not production. Without OPcache the
count()loop took 7.55 ms; with it, 1.13 ms. Benchmark with the same OPcache settings as your server. - Constant folding.
strlen("hello")in a loop is compiled to10. Feed benchmarks values the compiler cannot know. - Too small to matter. 0.04 vs 0.08 ms for one lookup is real but irrelevant; the 232 vs 0.37 ms case is the one that matters.
- Process start dominates. The empty script took 56 ms; a 5 ms optimization in a CLI tool is invisible next to that.
- Noise.
strworkvaried 254–268 ms between identical runs; differences under about 5% need many more runs.
Decision table
| Situation | Do this | Evidence |
|---|---|---|
| Any web server (FPM, mod_php, LiteSpeed) | opcache.enable=1 |
6.79 → 0.18 ms per request |
| One-shot CLI scripts, cron | leave enable_cli=0, or add opcache.file_cache |
64.7 vs 75.7 vs 58.3 ms |
| Pure arithmetic in PHP loops | opcache.jit=tracing (buffer > 0) |
334 → 75 ms |
| JSON, strings, arrays, DB | skip the JIT, fix algorithms | 261 → 240 ms |
| Building strings | .= or implode |
8.96 ms vs 7,961 ms |
| Many membership tests | array_flip once, then isset |
232 → 0.37 ms |
| Large inputs | generators | 0 MB vs a fatal error |
| Is the JIT on? | check opcache_get_status()['jit']['on'] |
buffer 0 silently disabled it |
Honest limits and version notes
- Measured on PHP 8.5.6 only, one Apple Silicon machine. The JIT's gains on x86-64 Linux servers will differ. We did not run older versions. From the PHP changelogs: the JIT was added in 8.0; in 8.4 the defaults changed to
opcache.jit=disablewithjit_buffer_size=64M(before,jit=tracingwith a buffer of 0, which also meant off). - No profiler extension was used. xdebug, SPX, xhprof and Blackfire would show per-function costs;
hrtimecan only time what you wrap. On a shared host you often cannot install them either, which is why this method is worth knowing. - The server test used PHP's single-threaded built-in server and sequential requests, not concurrent load. It shows the compile cost OPcache removes, not throughput.
memory_get_peak_usage()counts only PHP's own allocator. Memory taken by libraries (argon2 in lecture 5, image libraries, the SQLite engine) does not appear in it.
Exercise
1. This function returns the IDs of the active users. With 30,000 users and 10,000 active addresses it took 1,213 ms in our test. Without changing its output, make it fast, and say how you would prove the result is the same.
function activeIds(array $users, array $activeEmails): array {
    $out = [];
    foreach ($users as $u) {
        if (in_array($u['email'], $activeEmails, true)) $out = array_merge($out, [$u['id']]);
    }
    return $out;
}
Answer
Two quadratic patterns: in_array inside the loop, and array_merge that copies $out on every hit.
function activeIds(array $users, array $activeEmails): array {
    $active = array_flip($activeEmails);      // once: values become keys
    $out = [];
    foreach ($users as $u) {
        if (isset($active[$u['email']])) $out[] = $u['id'];
    }
    return $out;
}
One difference to check: in_array(..., true) compares strictly, while array keys convert numeric strings such as "123" to integers. For e-mail addresses that cannot happen. To prove equality, run both versions on the same seeded input (mt_srand(42)) and compare with ===. Our run: slow 1212.8 ms, fast 2.49 ms, 4625 ids, identical: true, about 490× faster.
This is the last PHP lecture. Lecture 5 covered the security side of the same code.
Previous: Lecture 5: XSS, CSRF and sessions · Back to the start: Lecture 1: types, strings and arrays
Related: Python lecture 6: profiling and optimization · Java lecture 6: JIT, GC and memory · Why prepared statements changed our JSON number types
FAQ
Does enabling OPcache on the PHP CLI make scripts faster?
Not for one-shot scripts. With opcache.enable_cli=1 our script that loads 2,000 classes took 74.5–75.7 ms per run instead of 63.9–64.7 ms (three sets of 20 runs), because the cache is built and thrown away in every process. Adding opcache.file_cache brought it to 58.2 ms. On the built-in server, which is one long-running process, OPcache cut a request from 6.79 ms to 0.18 ms.
How much faster is PHP 8.5 with the JIT?
It depends on the work. A CPU-bound Mandelbrot went from 334.4 ms (OPcache, JIT off) to 75.0 ms with opcache.jit=tracing, about 4.5×. A workload of json_encode, usort, explode and str_replace went from 261.2 ms to 240.2 ms, about 8%, because the time is spent inside functions written in C.
Is $s = $s . $x slower than $s .= $x in PHP?
Yes, dramatically in a loop. Building a 2.3 MB string from 200,000 pieces took 8.96 ms with .= and 7,961 ms with $s = $s . $x on PHP 8.5, because the second form copies the whole string every time. The JIT did not fix it.